
Breckenridge's Occupancy Forecast
Utilize the Breckenridge occupancy forecast to anticipate staffing needs and support business operations throughout the year. This forecast is updated every two weeks and available to all Breckenridge Business License holders.
Occupancy Forecast
November 1 Report
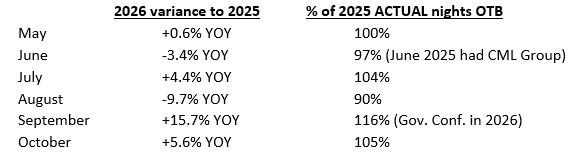
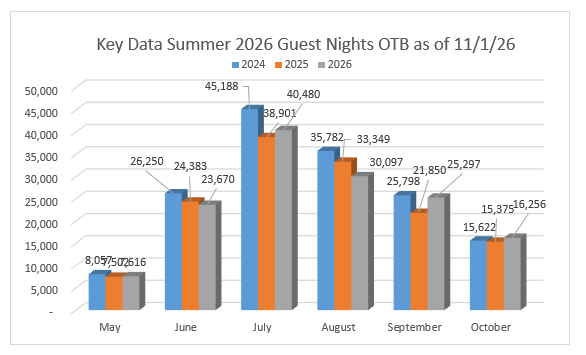
Breckenridge summer season guest nights on the books indicate Breckenridge has 1.4% more guest nights on the books than the 2025 summer season (+2,038 guest nights on over 143K guest nights on the books).
A monthly snapshot of summer season guest nights on the books:
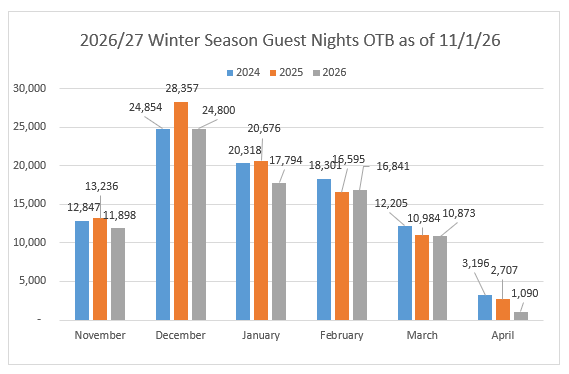
Winter season guest nights on the books are pacing -9% year over year and -8.1% to 2 years ago. Key Data indicates Breckenridge has 37% of last season’s actual guest nights on the books. Last season, Breckenridge had 41% of actual guest nights on the books.
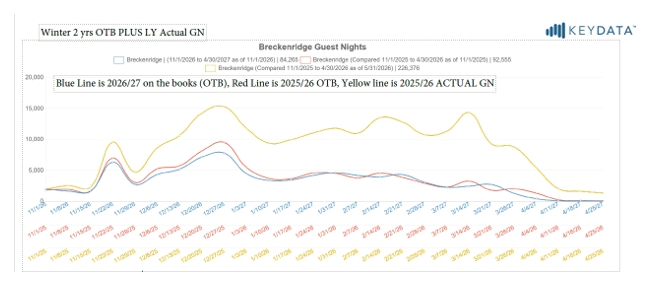
Below is a weekly graph of three winter seasons of guest nights on the books as of November 1.
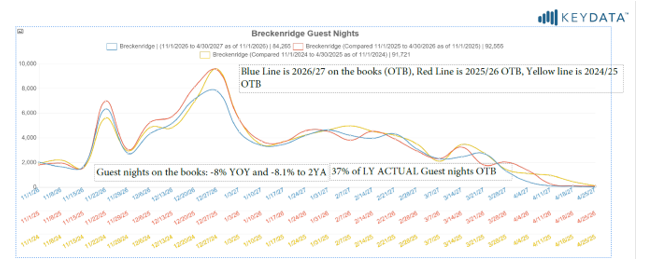
Below is a weekly graph of two seasons of guest nights on the books plus last season’s actual guest nights. The gap between the yellow line and the red line gives an indication of the fill that occurred last season.
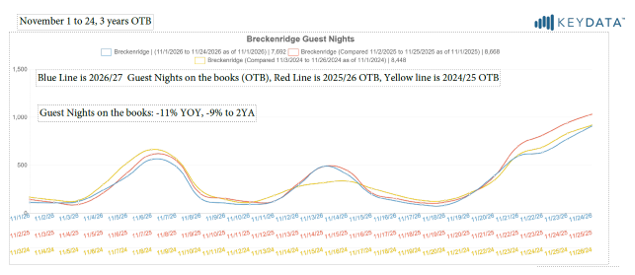
November 1 to November 24, with three seasons of guest nights on the books is on the daily graph below. Guest nights on the books are -11.3% year over year and -8.9% to 2 years. Breckenridge has 68% of last year’s actual guest nights on the books. Last season Breckenridge had 76% of last year’s actual guest nights on the books.
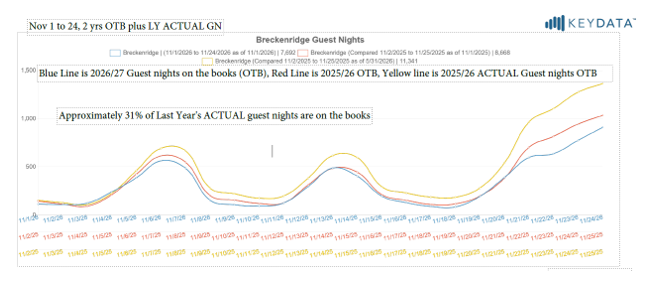
The graph below has two years of daily guest nights on the books, plus last season’s actual guest nights on the books. The patterns are nearly identical and provides an indication of the amount of fill to take place over the next three weeks.
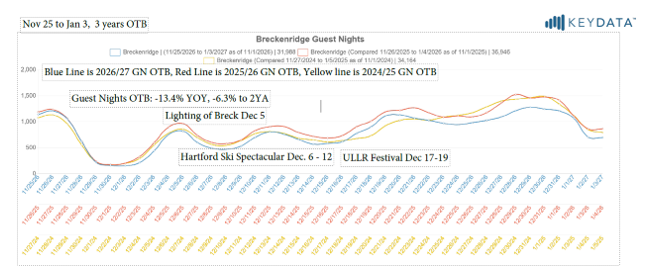
The daily graph below represents three seasons of guest nights on the books for the November 24 to January 3 dates. Guest nights on the books are -13.4% year over year and -6.3% to 2 years.
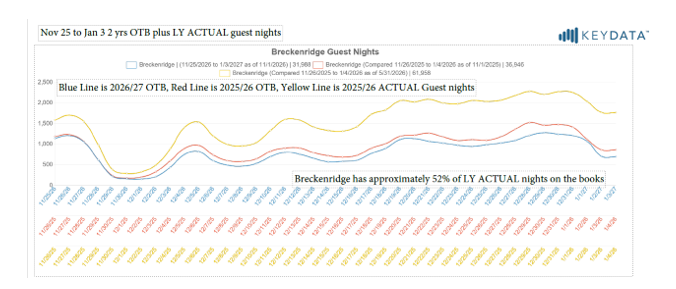
The daily graph below has two years of guest nights on the books plus last year’s actual guest nights on the books. Breckenridge has approximately 52% of last year’s actual guest nights on the books.
A close look at the Christmas holiday indicates some significant shortfalls of guest nights on the books. December 29, a peak night of the post-Christmas week has 12.4% fewer guest nights on the books year over year. December 27, typically a peak night of the week has 19.8% fewer guest nights on the books year over year. New Years Eve has 14.4% fewer guest nights on the books year over year. The nights of the post-Christmas week have between 50% and 55% of last year’s actual guest nights on the books.
A look at competitive destinations in the Key Data system indicates similar challenges to the holiday seasons. The Rocky Mountain region of Colorado and Utah is especially challenged. The Tahoe region is faring a little better than Colorado and Utah.
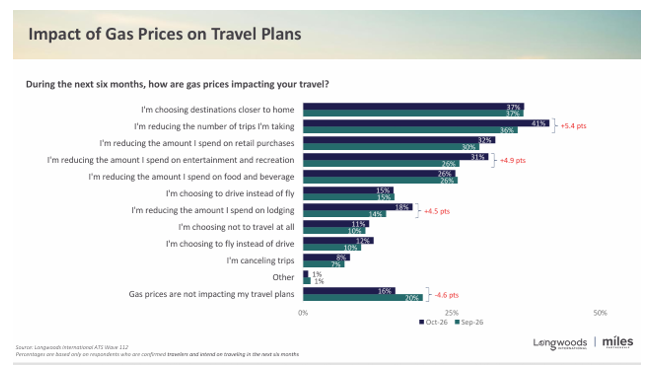
A Longwoods American Travel Sentiment Study of gas prices and holiday travel indicate travelers are staying closer to home, planning fewer trips, reducing the amount of money spent on entertainment and recreation, and reducing the amount they spend on Lodging.
American Travel Sentiment Wave 112 – Longwoods International
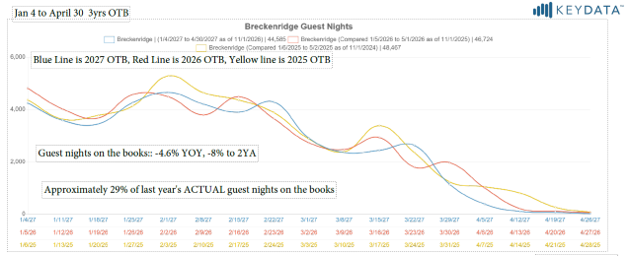
The graph below has 3 years of weekly guest nights on the books for January 3 to April 30. Guest nights on the books are -4.6% year over year and -8% to 2 years. Breckenridge has approximately 29% of last year’s actual guest nights on the books.
Consumer confidence is 91.7 in October, up 7.5 points from 84.2 in September. The appendix below has more detail. The University of Michigan survey of consumers index was relatively unchanged, 48.0 in October vs. 48.1 in September. The Fed’s held interest rates this month.
The November 1, 2026, Key Data reports include 59 properties and 3,314 total units, 2,891 in town units of the 4,070 licensed short-term rentals in Breckenridge plus hotel properties. The data includes resorts, private homes, and hotels. Many of these units are on Rent by Owner (RBO) sites Airbnb and VRBO.
Sign-up + Login Assistance
Breckenridge’s occupancy forecast is available to all Breckenridge Business License holders. This proprietary data can be accessed with a KeyData login. If you have questions about the report, are interested in signing up for a login or need helping logging in, contact Bill at bwishowski@gobreck.com
Consumer Confidence Index
The Conference Board Consumer Confidence Index® fell by 6.7 points to 81.9 (1985=100) in September, down from 88.6 in August. The Present Situation Index—based on consumers’ assessment of current business and labor market conditions—retreated by 7.9 points to 109.3. The Expectations Index—based on consumers’ short-term outlook for income, business, and labor market conditions—fell by 5.9 points to 63.6, its third consecutive monthly decline. The survey period for this month’s preliminary results was September 1-23, which included a federal funds rate hike and ongoing geopolitical tensions.
“The Consumer Confidence Index deteriorated notably in September, following two prior months of softening,” said Dana M Peterson, Chief Economist, The Conference Board. “The Present Situation Index fell sharply, while the Expectations Index slipped further into negative territory. Consumer appraisals of current business conditions became negative for the first time since September 2024. Perceptions of the current labor market also worsened, though remained within positive territory. Over the next six months, consumers expected both business conditions and the labor market to weaken. Consumers still anticipated their household incomes to rise, but less so compared to previous months.”
University of Michigan Consumer Sentiment Index
Surveys of Consumers Director Joanne Hsu
Consumer sentiment was little changed this month, inching down a scant 1.8 index points from September. While year-ahead expectations for personal finances and business conditions crept up slightly, buying conditions for durables plummeted amid high prices and borrowing costs. Increases in sentiment among Democrats and Republicans were offset by a decline among independents this month. Overall, sentiment for lower-income consumers and those with smaller stock portfolios dropped steeply this month, groups that have fewer resources to weather increases in prices. Frustration over cost-of-living continues to mount, as consumers across the political spectrum believe that the trajectory of the economy has weakened since the beginning of the year.
Year-ahead inflation expectations ticked up from 4.6% last month to 4.7% this month. The current reading substantially exceeds the 3.4% seen in February before the Iran conflict began, along with all 2024 readings. Long-run inflation expectations also stepped up from 3.4% in September to 3.5%, notably higher than their 2024 range of 2.8% to 3.2%. Inflation expectations over both time horizons increased for the second straight month to their highest readings since May.